Using the ElasticPress Debugging Add-On Plugin
ElasticPress is a sophisticated plugin that tightly integrates with WordPress core, themes, and plugins. As a result, debugging ElasticPress can be tricky business for even experienced developers. To enable you to see the queries that are sent to ElasticPress.io and debug any issues, you’ll need to use our Debugging Add-On with Debug Bar or Query Monitor. Follow these simple steps to install and use the ElasticPress Debugging Add-On Plugin.
Installation
First, you’ll need to install the Debug Bar (or Query Monitor) plugin and the ElasticPress Debugging Add-On plugin.
- Ensure you are logged into your WordPress site, and navigate to the Admin Menu (e.g. https://yoursiteurl.com/wp-admin/)
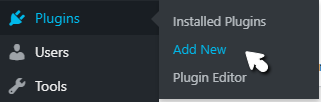
- From the menu bar, select Plugins and then Add New.
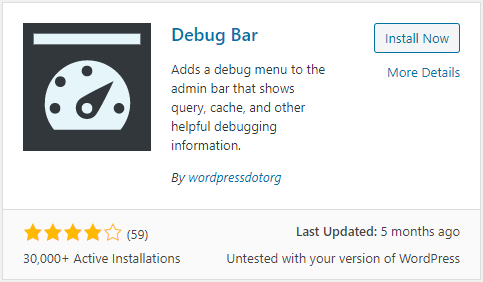
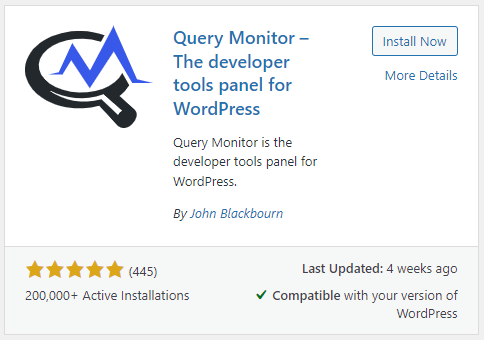
- Search for Debug Bar or Query Monitor and click the Install Now button.
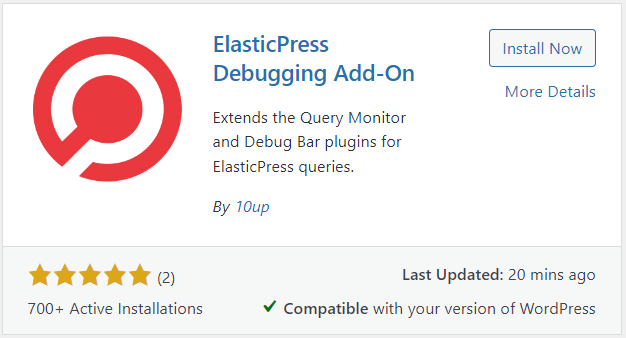
- Next, search for the ElasticPress Debugging Add-On plugin and click the Install Now button.
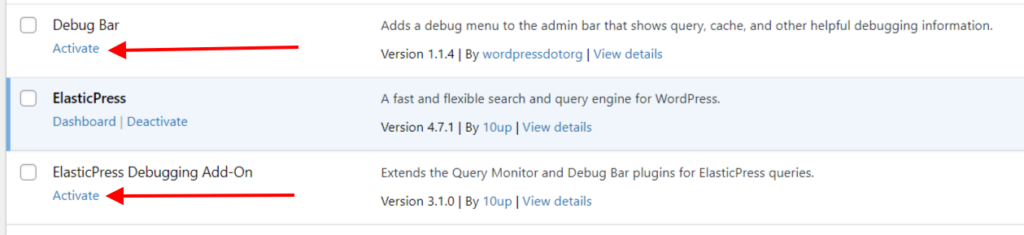
- Return to the Admin menu, select Plugins, and then Installed Plugins.
- Locate the two plugins you just installed and click Activate on each.
WARNING: Having the Debug Bar or Query Monitor and ElasticPress Debugging Add-On plugins enabled on your site is likely to negatively impact site performance. Make sure to only enable these plugins while actively debugging / troubleshooting and to disable them again when you are finished.
Using the Debug Bar
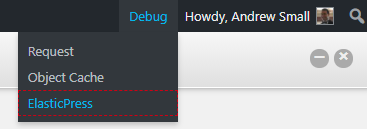
Enabling the Debug Bar will add a Debug link to the admin bar at the top of your browser window.

Navigate to the page that isn’t behaving as expected. For example, if a search page is returning no results, go to that page, hover over the Debug link, and then click ElasticPress from the drop-down menu.
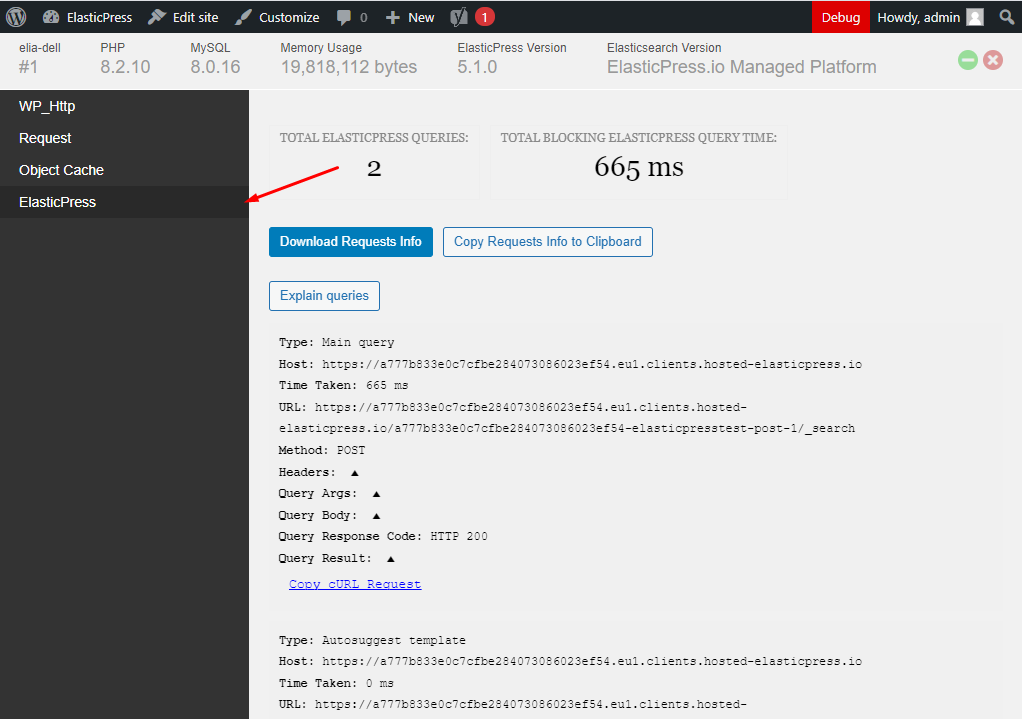
This will bring a page with all the ElasticPress queries run by the page.
REMINDER: Having the Debug Bar and ElasticPress Debugging Add-On plugins enabled on your site is likely to negatively impact site performance. Make sure to only enable these plugins while actively debugging/troubleshooting and disable them again when you are finished.
Using Query Monitor
Enabling Query Monitor will add some statistics to the admin bar at the top of your browser window.
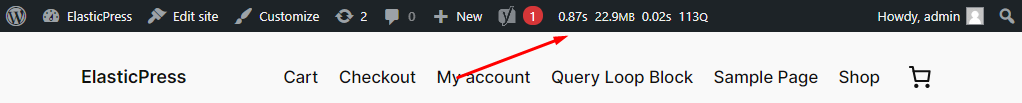
On any page of your site click on those numbers and then click ElasticPress:
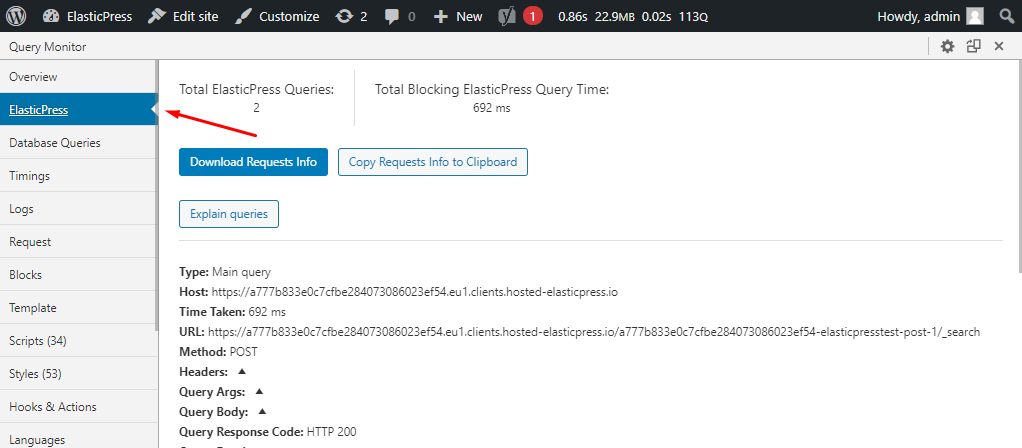
Sharing Requests Info
Opening the ElasticPress panel, using either Debug Bar or Query Monitor, will display the Download Requests Info and Copy Requests Info to Clipboard. Those buttons allow you to capture all the related information to the Elasticsearch queries executed on the current screen.
Elasticsearch Queries Explained
Sometimes it is not easy to understand why Elasticsearch considers some search results a match. In cases like those, you can click on the Explain queries button to reload the page, then open the Query Body section. Inside each post object, there will be an _explanation attribute with the scoring criteria.
Debugging AJAX and REST API requests
Using Debug Bar or Query Monitor can help to debug queries sent by WordPress on a regular page. To debug AJAX, indexing operations, or REST API requests, it is possible to set ElasticPress Debugging Add-On Plugin to store requests depending on the context.
To do so, go to your WordPress Dashboard, and then go to ElasticPress > Query Log. On the next screen, you can enable, disable, and enable query logging for only 5 minutes. You can also choose to log all queries or only the ones that fail, and lastly, you can choose which contexts should be captured:
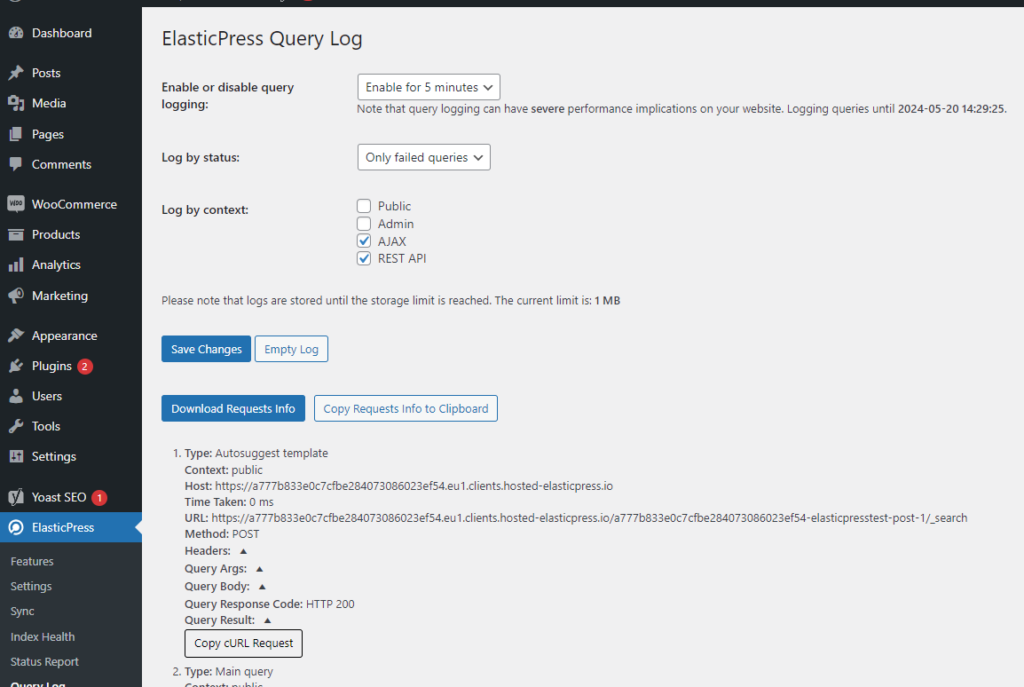
IMPORTANT: It is extremely important that you do not keep this functionality enabled for a long period, as it can cause severe performance problems. After you are done debugging, you can clear all the stored queries by clicking on the Empty Log button.